Workshop overview

Year level 10-12
Capacity 16-32 students. If you want to bring more students, email highschool.workshops@qut.edu.au
When School days: Monday-Friday
Duration Half day
Where QUT Gardens Point, Science and Engineering Centre
Cost

Free (Late cancellation fees apply. Please refer to Terms and Conditions.)

Workshop details

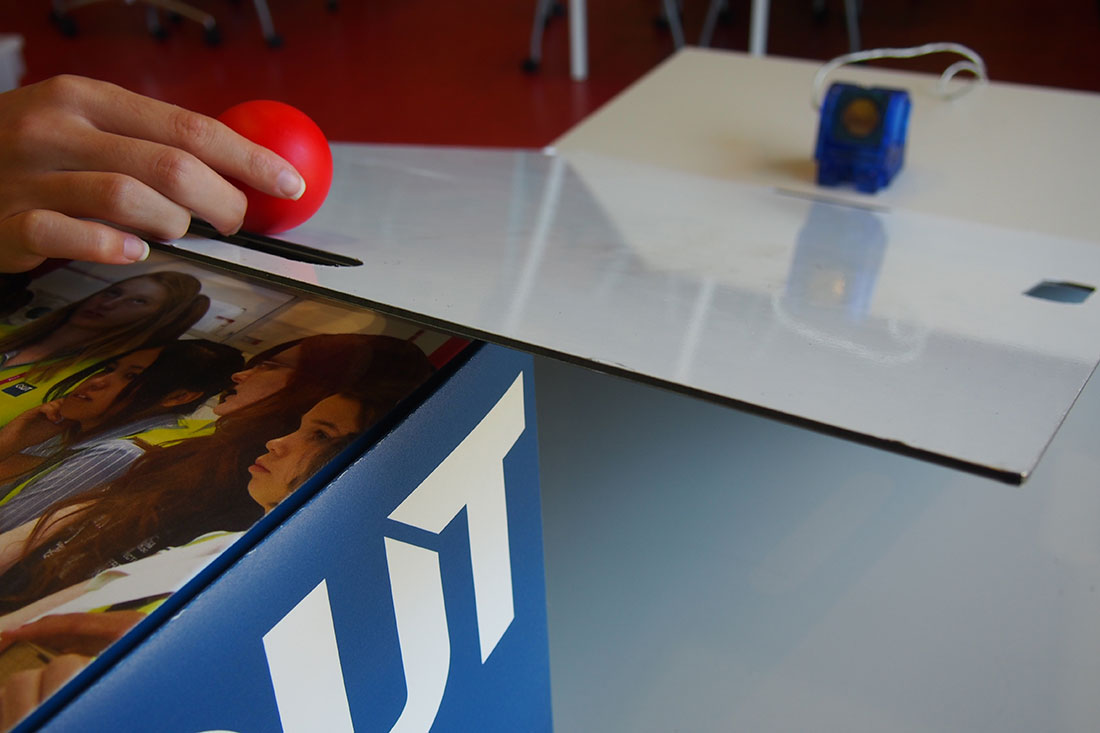
This workshop investigates how technology fits a curve to data.

Students collect different types of data using motion sensors, ramps, balls and springs, and learn how to identify and fit suitable mathematical models to represent the data. They also learn how to test the quality of the fitted model and provide evidence that supports using that model as a fair and accurate representation of data. Students will learn about the difference between linear and non-linear regression, scatter plots, correlation and errors.

This workshop is particularly useful for students collecting data and writing reports for assignments.

Topics covered in this workshop:

  • mathematics
  • physics
  • technology.

Book this workshop

We're fully booked for terms 1 and 2 and unable to take any further bookings.

Subscribe to our mailing list for the release of term 3 and 4 workshop availability.

Curriculum links

Year 10

Mathematics

  • Factorise algebraic expressions by taking out a common algebraic factor (ACMNA230)
  • Expand binomial products and factorise monic quadratic expressions using a variety of strategies (ACMNA233)
  • Substitute values into formulas to determine an unknown (ACMNA234)
  • Solve problems involving linear equations, including those derived from formulas (ACMNA235)
  • Solve linear simultaneous equations, using algebraic and graphical techniques, including using digital technology (ACMNA237)
  • Explore the connection between algebraic and graphical representations of relations such as simple quadratics, circles and exponentials using digital technology as appropriate (ACMNA239)

Science

  • Plan, select and use appropriate investigation types, including field work and laboratory experimentation, to collect reliable data; assess risk and address ethical issues associated with these methods (ACSIS199)
  • Select and use appropriate equipment, including digital technologies, to collect and record data systematically and accurately (ACSIS200)
  • Analyse patterns and trends in data, including describing relationships between variables and identifying inconsistencies (ACSIS203)
  • Critically analyse the validity of information in primary and secondary sources, and evaluate the approaches used to solve problems (ACSIS206)
  • Communicate scientific ideas and information for a particular purpose, including constructing evidence-based arguments and using appropriate scientific language, conventions and representations (ACSIS208)

Design and Technologies

  • Develop project plans using digital technologies to plan and manage projects individually and collaboratively taking into consideration time, cost, risk and production processes (ACTDEP052)

Year 10A

Mathematics

  • Investigate the concept of a polynomial and apply the factor and remainder theorems to solve problems (ACMNA266)
  • Describe, interpret and sketch parabolas, hyperbolas, circles and exponential functions and their transformations (ACMNA267)
  • Apply understanding of polynomials to sketch a range of curves and describe the features of these curves from their equation (ACMNA268)
  • Factorise monic and non-monic quadratic expressions and solve a wide range of quadratic equations derived from a variety of contexts (ACMNA269)
  • Use information technologies to investigate bivariate numerical data sets. Where appropriate use a straight line to describe the relationship allowing for variation (ACMSP279)

Science

  • Plan, select and use appropriate investigation types, including field work and laboratory experimentation, to collect reliable data; assess risk and address ethical issues associated with these methods (ACSIS199 )
  • Select and use appropriate equipment, including digital technologies, to collect and record data systematically and accurately (ACSIS200)
  • Analyse patterns and trends in data, including describing relationships between variables and identifying inconsistencies (ACSIS203)
  • Critically analyse the validity of information in primary and secondary sources, and evaluate the approaches used to solve problems (ACSIS206)
  • Communicate scientific ideas and information for a particular purpose, including constructing evidence-based arguments and using appropriate scientific language, conventions and representations (ACSIS208)

Years 11 and 12

Mathematical Methods

  • Examine examples of direct proportion and linearly related variables (ACMMM002)
  • Recognise features of the graph of y=mx+c, including its linear nature, its intercepts and its slope or gradient (ACMMM003)
  • Examine examples of quadratically related variables (ACMMM006)
  • Find the equation of a quadratic given sufficient information (ACMMM009)
  • Examine examples of inverse proportion (ACMMM012)
  • Expand quadratic and cubic polynomials from factors (ACMMM016)
  • Understand the concept of a function as a mapping between sets, and as a rule or a formula that defines one variable quantity in terms of another (ACMMM022)
  • Identify contexts suitable for modelling by exponential functions and use them to solve practical problems (ACMMM066)
  • Use the Leibniz notation δx and δy for changes or increments in the variables x and y (ACMMM078)
  • Interpret the derivative as the instantaneous rate of change (ACMMM084)
  • Recognise and use linearity properties of the derivative (ACMMM090)
  • Find instantaneous rates of change (ACMMM092)
  • Construct and interpret position-time graphs, with velocity as the slope of the tangent (ACMMM094)
  • Solve optimisation problems arising in a variety of contexts involving simple polynomials on finite interval domains (ACMMM096)

General Mathematics

  • Construct straight-line graphs both with and without the aid of technology (ACMGM040)
  • Determine the slope and intercepts of a straight-line graph from both its equation and its plot (ACMGM041)
  • Interpret, in context, the slope and intercept of a straight-line graph used to model and analyse a practical situation (ACMGM042)
  • Construct and analyse a straight-line graph to model a given linear relationship; for example, modelling the cost of filling a fuel tank of a car against the number of litres of petrol required. (ACMGM043)
  • Identify the response variable and the explanatory variable (ACMGM055)
  • Use a scatterplot to identify the nature of the relationship between variables (ACMGM056)
  • Model a linear relationship by fitting a least-squares line to the data (ACMGM057)
  • Interpret the intercept and slope of the fitted line (ACMGM059)
  • Use the coefficient of determination to assess the strength of a linear association in terms of the explained variation (ACMGM060)
  • Use the equation of a fitted line to make predictions (ACMGM061)
  • Write up the results of the above analysis in a systematic and concise manner. (ACMGM063)
  • Display the terms of a geometric sequence in both tabular and graphical form and demonstrate that geometric sequences can be used to model exponential growth and decay in discrete situations (ACMGM072)
  • Deduce a rule for the nth term of a particular geometric sequence from the pattern of the terms in the sequence, and use this rule to make predictions (ACMGM073)
  • Use geometric sequences to model and analyse (numerically, or graphically only) practical problems involving geometric growth and decay; for example, analysing a compound interest loan or investment, the growth of a bacterial population that doubles in size each hour, the decreasing height of the bounce of a ball at each bounce; or calculating the value of office furniture at the end of each year using the declining (reducing) balance method to depreciate. (ACMGM074)

Physics

  • Conduct investigations, including using temperature, current and potential difference measuring devices, safely, competently and methodically for the collection of valid and reliable data (ACSPH003)
  • Represent data in meaningful and useful ways, including using appropriate Système Internationale (SI) units and symbols; organise and analyse data to identify trends, patterns and relationships; identify sources of random and systematic error and estimate their effect on measurement results; identify anomalous data and calculate the measurement discrepancy between experimental results and a currently accepted value, expressed as a percentage; and select, synthesise and use evidence to make and justify conclusions (ACSPH004)
  • Select, use and interpret appropriate mathematical representations, including linear and non-linear graphs and algebraic relationships representing physical systems, to solve problems and make predictions (ACSPH007)
  • Design investigations, including the procedure to be followed, the materials required, and the type and amount of primary and/or secondary data to be collected; conduct risk assessments; and consider research ethics (ACSPH046)
  • Select, use and interpret appropriate mathematical representations, including linear and non-linear graphs and algebraic relationships representing physical systems, to solve problems and make predictions (ACSPH051)
  • Uniformly accelerated motion is described in terms of relationships between measurable scalar and vector quantities, including displacement, speed, velocity and acceleration (ACSPH060)
  • Representations, including graphs and vectors, and/or equations of motion, can be used qualitatively and quantitatively to describe and predict linear motion (ACSPH061)
  • Vertical motion is analysed by assuming the acceleration due to gravity is constant near Earth’s surface (ACSPH062)
  • Collisions may be elastic and inelastic; kinetic energy is conserved in elastic collisions (ACSPH066)
  • Conduct investigations, including the manipulation of force measurers and electromagnetic devices, safely, competently and methodically for the collection of valid and reliable data (ACSPH080)
  • Represent data in meaningful and useful ways, including using appropriate SI units, symbols and significant figures; organise and analyse data to identify trends, patterns and relationships; identify sources of uncertainty and techniques to minimise these uncertainties; utilise uncertainty and percentage uncertainty to determine the uncertainty in the result of calculations, and evaluate the impact of measurement uncertainty on experimental results; and select, synthesise and use evidence to make and justify conclusions (ACSPH081)
  • Select, construct and use appropriate representations, including text and graphic representations of empirical and theoretical relationships, vector diagrams, free body/force diagrams, field diagrams and circuit diagrams, to communicate conceptual understanding, solve problems and make predictions (ACSPH083)
  • Select, use and interpret appropriate mathematical representations, including linear and non-linear graphs and algebraic relationships representing physical systems, to solve problems and make predictions (ACSPH084)
  • ICT and other technologies have dramatically increased the size, accuracy and geographic and temporal scope of datasets with which scientists work (ACSPH086)
  • The movement of free-falling bodies in Earth’s gravitational field is predictable (ACSPH093)
  • Projectile motion can be analysed quantitatively by treating the horizontal and vertical components of the motion independently (ACSPH099)
  • Select, construct and use appropriate representations, including text and graphic representations of empirical and theoretical relationships, simulations, simple reaction diagrams and atomic energy level diagrams, to communicate conceptual understanding, solve problems and make predictions (ACSPH119)
  • Select, use and interpret appropriate mathematical representations, including linear and non-linear graphs and algebraic relationships representing physical systems, to solve problems and make predictions (ACSPH120)

Contact us

Contact us if you've got questions about the High School Student Engagement program, or subscribe to our mailing list to stay up-to-date with news and events.